Subscribe to to stay in the know
Get our newsletter and latest updates about our company, what we are working on, and other cloud-related news.
Onix Data Observability watches your data, your pipelines and the AI that depends on them. When something breaks, it finds the cause, sends it to the team that owns it and gets the fix applied, so incidents close in minutes instead of days.


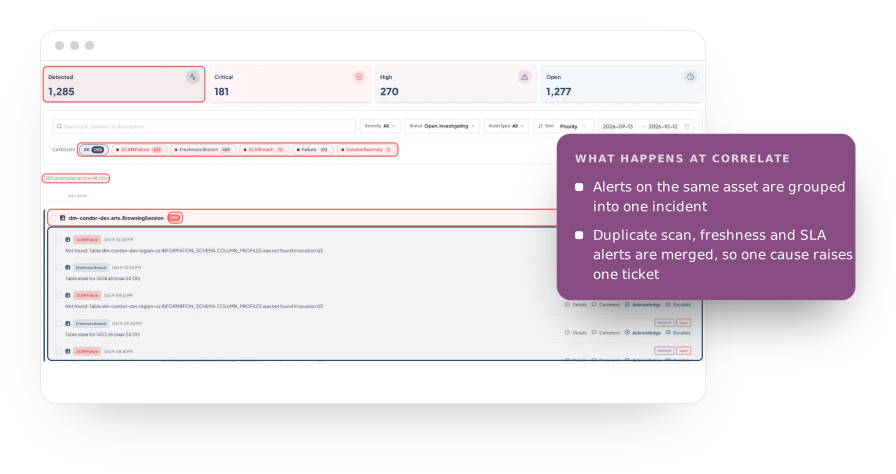
Three views instead of a wall of metrics. Each one shows what changed, in plain terms, and what it affects downstream.
continuous monitoring across every platform you run
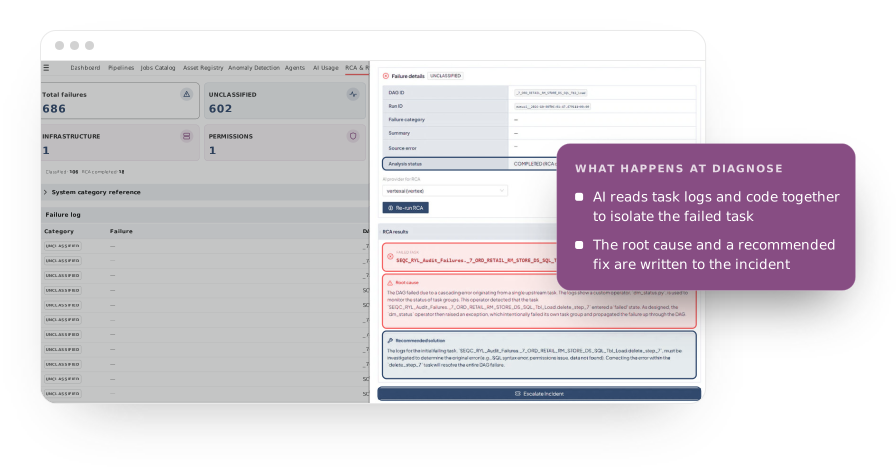
to find the root cause, with AI reading logs and code
alerts go straight to the team that owns the asset
schedulers, on-prem databases, cloud ETL and BI
From live pipeline health and SLA monitoring to root-cause diagnostics and autonomous remediation, your data engineers work reliability, lineage and anomalies from one platform.
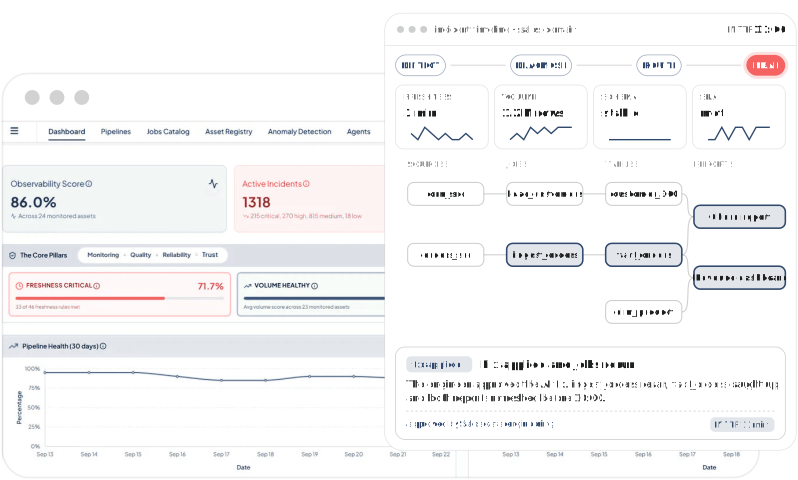
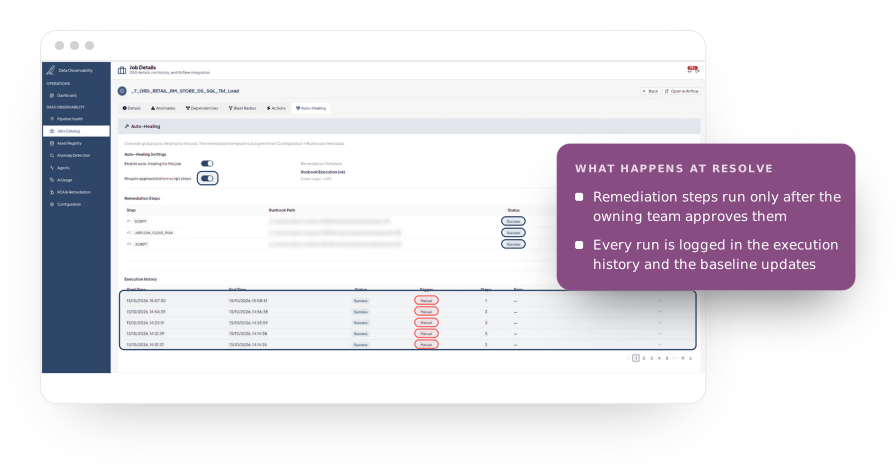
Track high-priority pipelines, data health and SLA performance across departments. Engineering and business teams each get the view they need, and stalled, delayed or failing jobs surface before downstream consumers feel them.

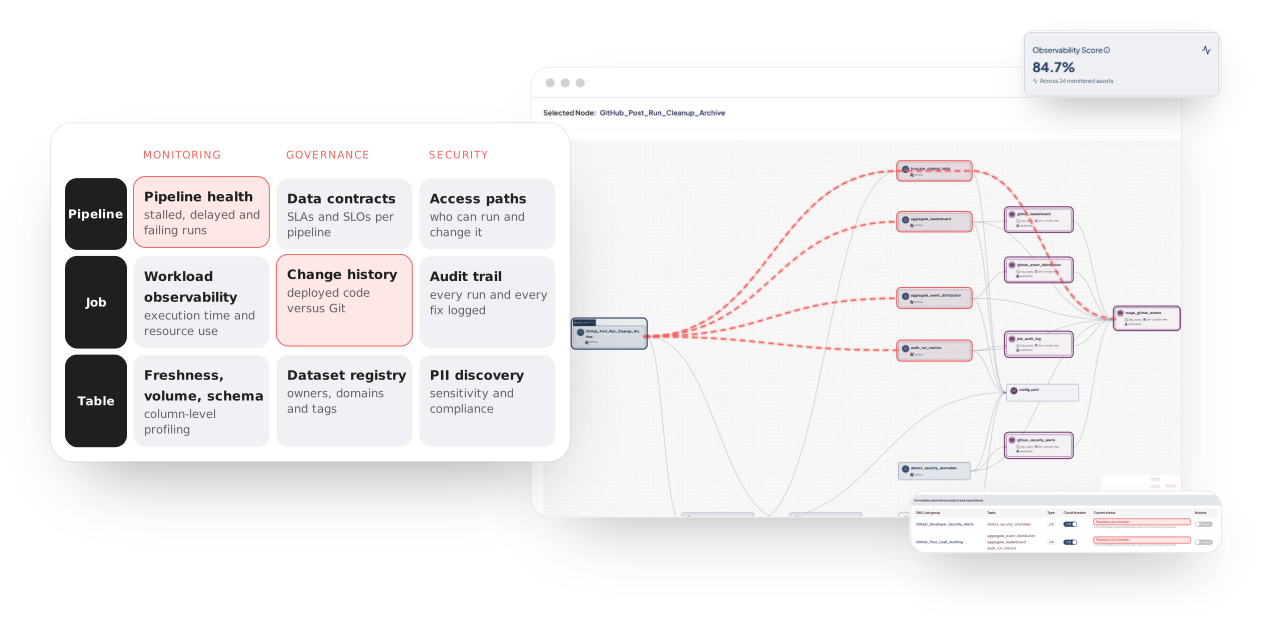
One shared map means every capability sees the same lineage and context

Access patterns, drift, lineage and freshness in one unified view

Prebuilt and custom monitors, configured per asset
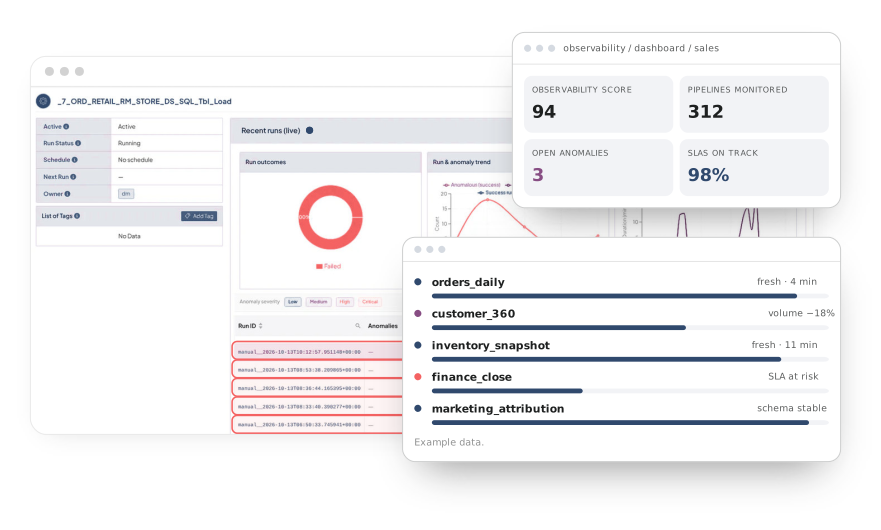
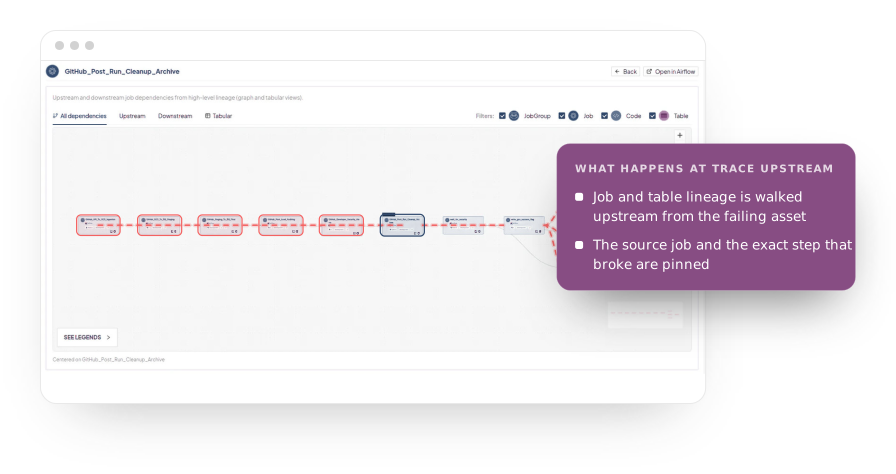
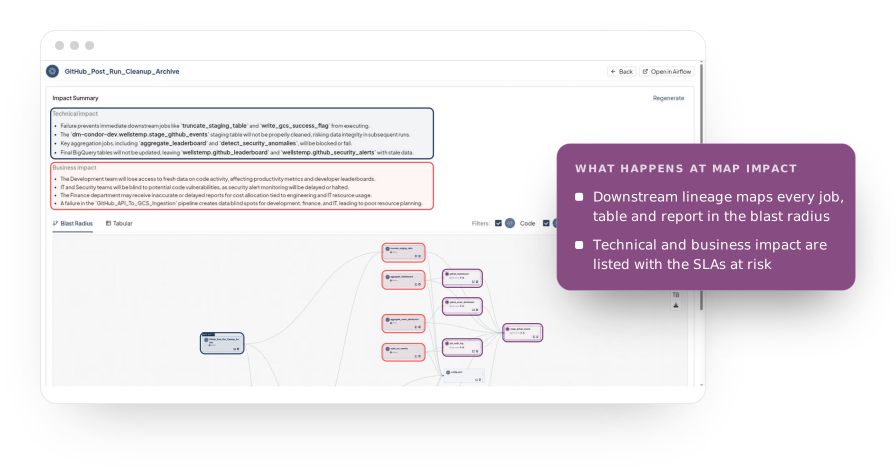
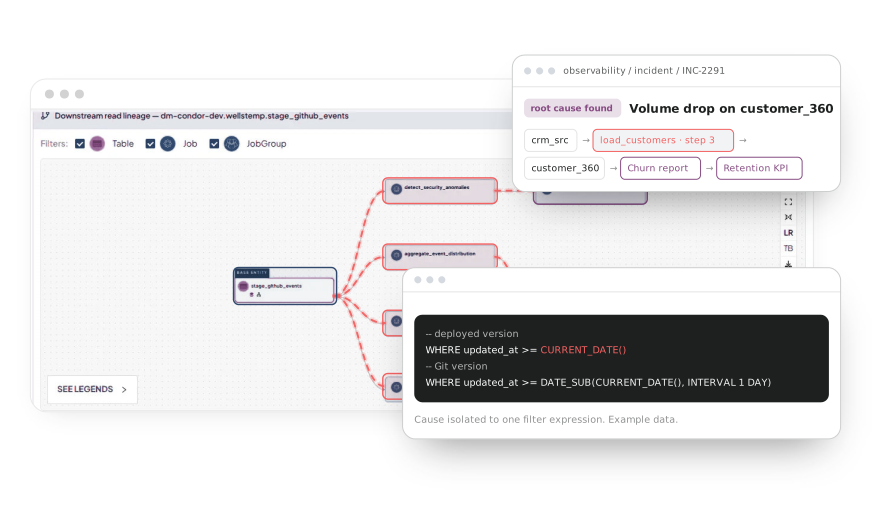
Map data flow from raw ingestion down to BI dashboards. Run root cause analysis on the spot, see the blast radius across dependent assets, and open stack traces, execution metrics and code snapshots without switching tools.

Configurable observability score across freshness, volume, schema drift and SLA KPIs

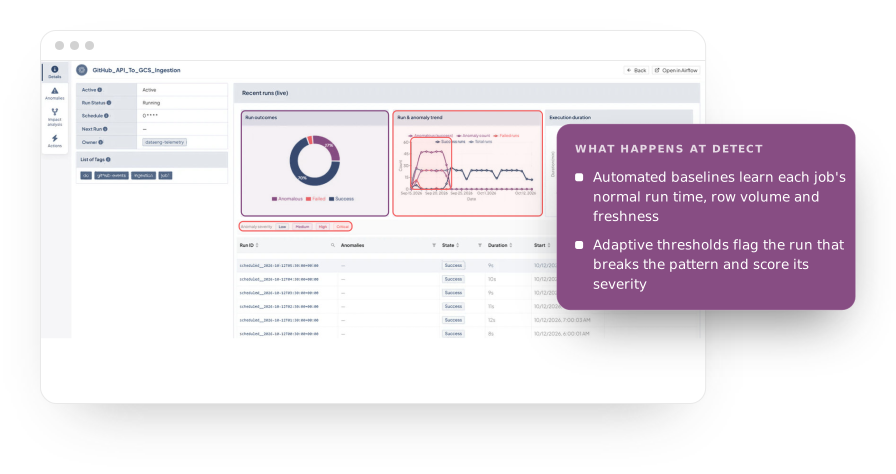
Anomaly detection with automated baselining, correlated and deduplicated to cut alert noise

Workload and job observability across execution times and resource consumption
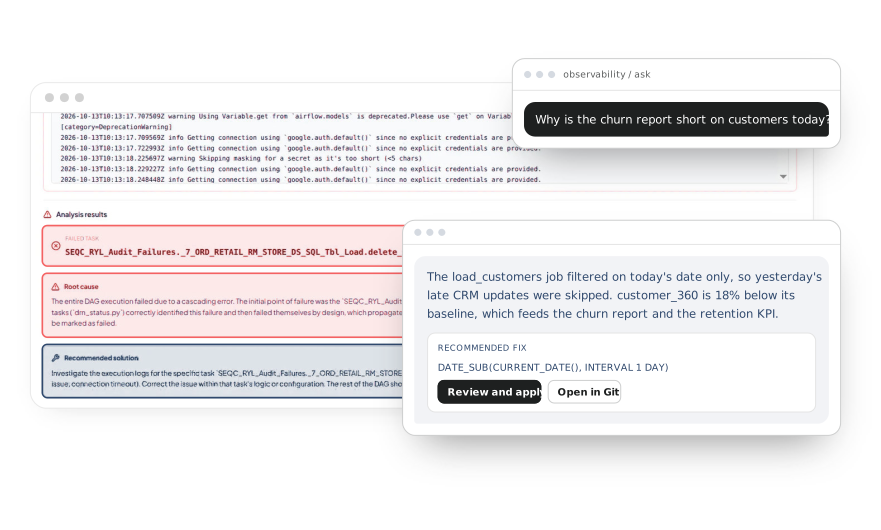
Query your stack in plain language. When a pipeline fails, the AI remediation advisor explains the cause, recommends the fix and writes the code change. Your team reviews it and applies it, and recovery workflows rerun the affected tasks.

Lineage, impact and blast radius across dependent assets

AI remediation advisor with fix recommendations and code patches

AI self healing and anomaly rule ID that adapt as data evolves
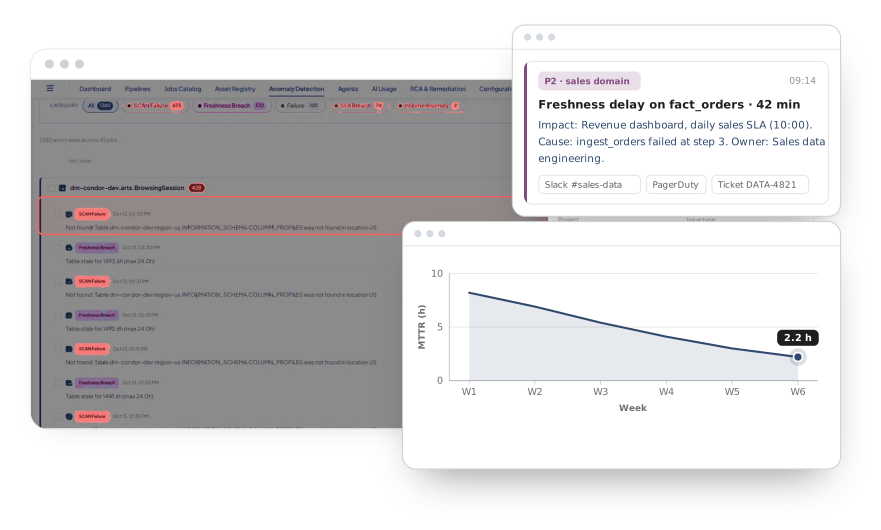
Tickets open automatically with the cause, the impact and the owner attached. SLA tracking and MTTR reporting show how fast incidents close, and alerts go to the channels your teams already use.

Multi-tenancy with role-based access and full audit logging

PII discovery and continuous compliance monitoring

Data assets registry with per-asset profiling and custom monitors KPI boxes:
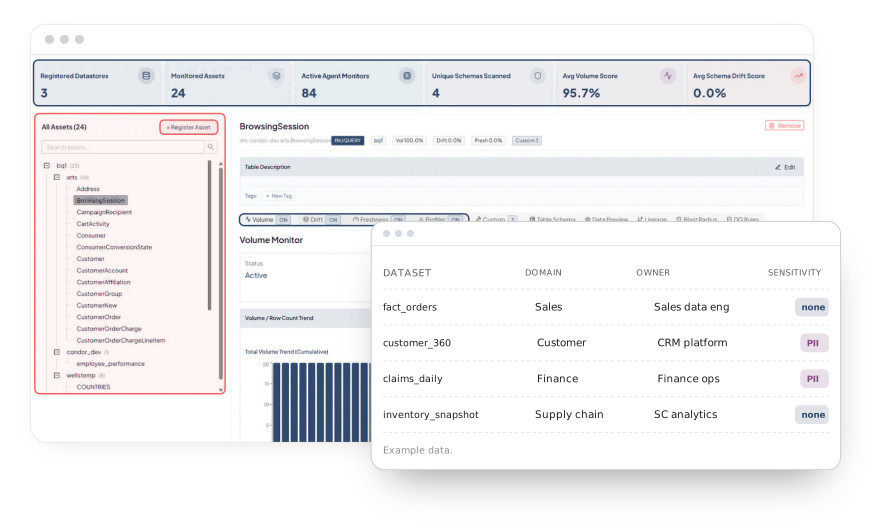
Register datastores, schemas and tables with owners and domains. Multi-tenancy keeps business units separate, role-based access controls who sees and changes what, and PII discovery flags sensitive columns as they appear.

Multi-tenancy with role-based access and full audit logging

PII discovery and continuous compliance monitoring

Data assets registry with per-asset profiling and custom monitors KPI boxes:
Years of enterprise migrations taught us how data flows through SQL, ETL and reports. That lineage is what turns an alert into a business impact.
Schedulers, on-prem databases, cloud ETL and BI reports sit side by side, so hybrid estates are covered end to end.
AI reads logs and code together and isolates the cause to the exact filter, join or step that changed.
Each anomaly arrives with the reports, SLAs and domains it touches, so priorities are clear from the first minute.
Reliable data underneath means the Onix Semantic Twin, and every agent that reads it, answers from sound sources.
Deep Google Cloud expertise, with coverage that extends to every other platform in your estate.
A unified platform for data, operations and AI observability. It watches your tables, pipelines, SLAs and the data your AI depends on. When something breaks, it detects it, finds the cause, routes it to the owning team and helps apply the fix, which keeps MTTR low.
The team that owns the affected asset. Ownership comes from the dataset registry, and each incident opens with a ticket and a message in the channel that team already uses, such as Slack, Microsoft Teams, PagerDuty, Jira or ServiceNow.
Cloud, on-prem and legacy systems, including Google Cloud and BigQuery, Teradata, Snowflake, Databricks, Informatica, Control-M, Autosys, Composer and Airflow, and BI tools such as Looker and Tableau.
It does both. It detects the anomaly, runs AI analysis on logs and code to isolate the cause, and recommends a fix with the code change attached. Your team reviews and applies it, and recovery workflows can rerun failed tasks or quarantine bad records.
No. You configure it per domain across multiple KPIs, including freshness, volume, schema, SLAs, workload and job performance, and weight each one to match what that domain cares about.
Yes. Configure monitoring at each asset and agent level, with prebuilt or custom rules, baselines and frequencies. Thresholds adapt to your environment as data patterns change.
Role-based access control and multi-tenancy keep business units separate. A dataset registry records owners and domains, and PII discovery flags sensitive columns.
They work together. Data Observability keeps the data underneath the Semantic Twin reliable, so every definition and every agent that depends on it reads from sources you can trust.
Get our newsletter and latest updates about our company, what we are working on, and other cloud-related news.